Debugging
As a TouchGFX application is a set of C++ files generated by TouchGFX Designer, TouchGFX Generator and written by the developer, it can be debugged as any other C++ application.
Target Debugging
If you are using an IDE like IAR Workbench, Keil uVision or STM32CubeIDE, debugging on target is straight forward using the available mechanisms of that IDE. TouchGFX projects generated by TouchGFX Generator or directly from a TouchGFX Board Setup is ready for debugging using the selected tool chain.
Board bring up code and TouchGFX AL is executed only on your target board and needs to be debugged there. The UI part of your application can be debugged either on target or using the simulator. On target you will typically debug things like performance issues, such as animation speed, update frequency and responsiveness. Other UI specific issues can be debugged on target but is often faster to debug using the simulator.
Simulator Debugging
Debugging UI related issues such as animation movements, transitions, element updates, program logic and so on, is in most cases much more efficient to test and debug using the simulator instead of flashing your board each time.
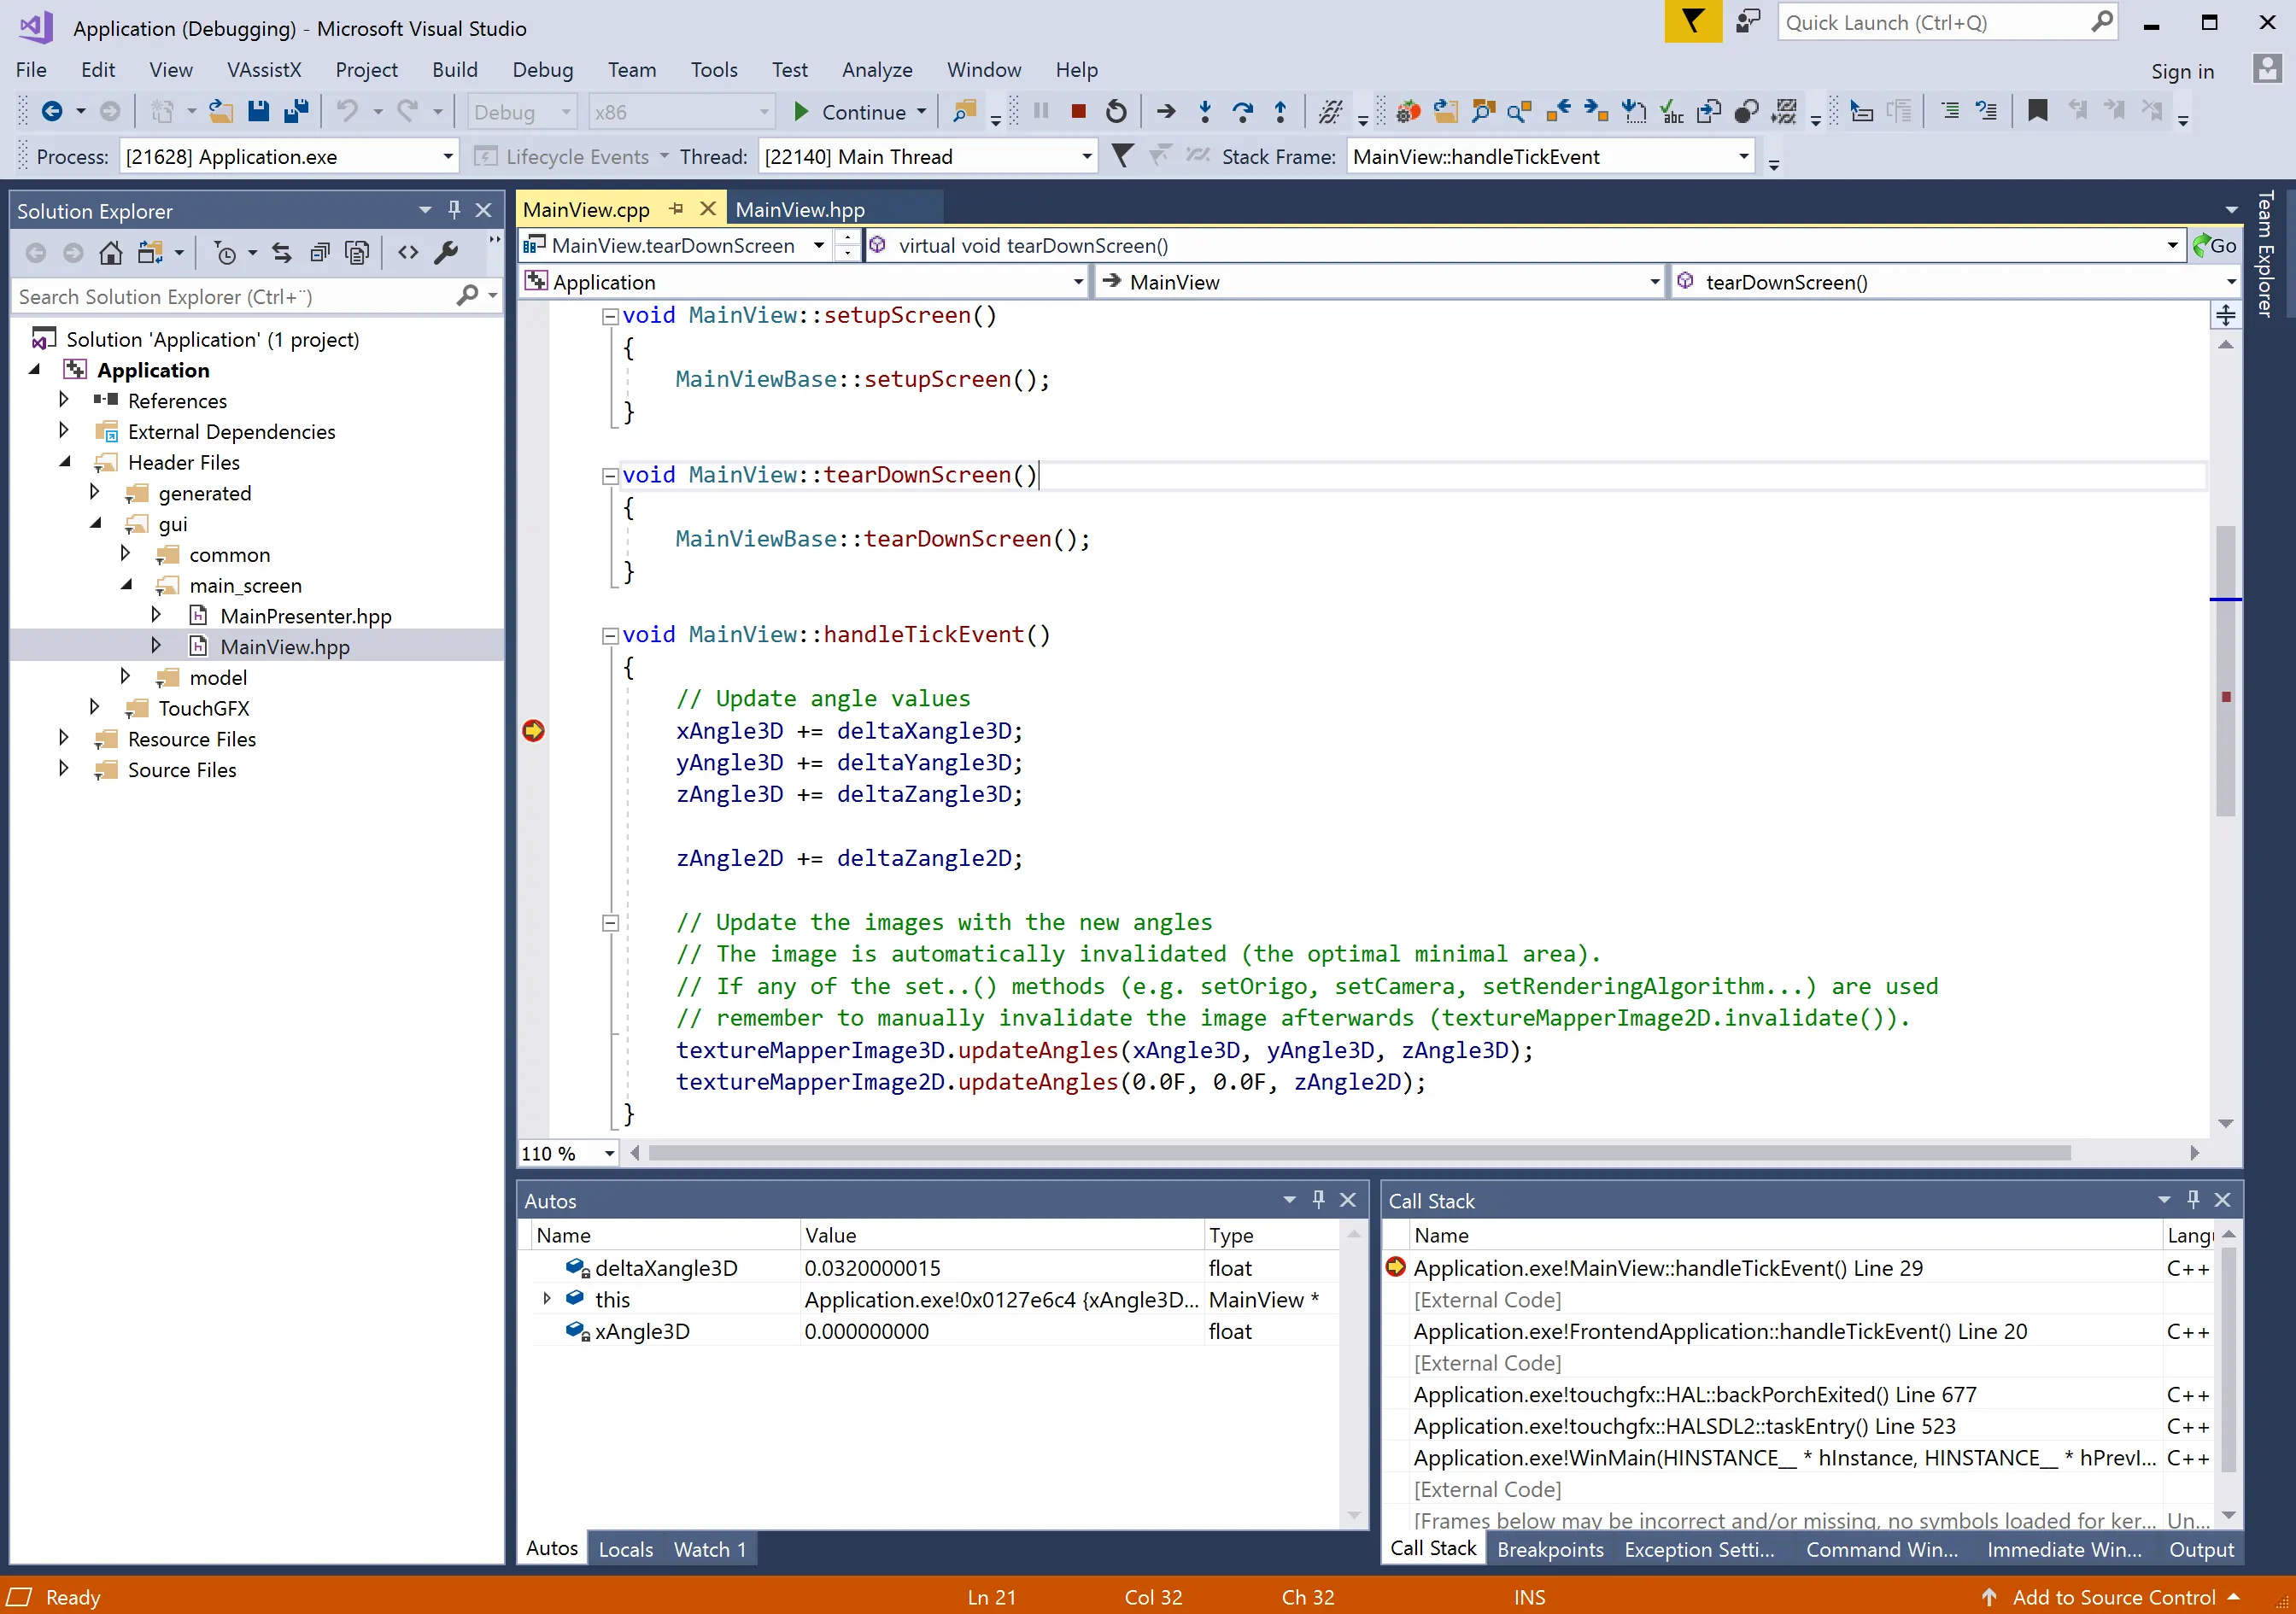
TouchGFX applications comes with support for Visual Studio and supplies and maintains a project file for it. Using Visual Studio you are able to run the simulator in debug mode, utilizing all the debug features of the IDE.
You are not restricted to Visual Studio if you want to debug using the simulator. The application can be compiled with GCC and if you are using a different IDE this can most likely be set up to debug a GCC compiled project. However, you need to configure your IDE to do this on your own.
Debugging in Visual Studio
Using the DebugPrinter
The DebugPrinter class is an easy way to print debug messages on the display without adding a TextArea or other widgets to the screens. For example, this can be used to show events from a backend or measurements like FPS or rendering time.
Before you can use the DebugPrinter you need to allocate an instance and pass it to the Application class. This can be done e.g. in the constructor of FrontendApplication:
The debug printer needs to be compatible with the framebuffer format. Here we add a 16bpp debug printer in gui/src/common/FrontendApplication.cpp:
#include <gui/common/FrontendApplication.hpp>

#include <platform/driver/lcd/LCD16bpp.hpp>
LCD16DebugPrinter lcd16bppDebugPrinter;

FrontendApplication::FrontendApplication(Model& m, FrontendHeap& heap)
  : FrontendApplicationBase(m, heap)
{
  lcd16bppDebugPrinter.setPosition(0, 0, 240, 40);
  lcd16bppDebugPrinter.setScale(2);
  lcd16bppDebugPrinter.setColor(0x00); //black
  Application::setDebugPrinter(&lcd16bppDebugPrinter);
}
Here we have configured the DebugPrinter to write in the upper 240 x 40 pixels.
In your application you can now print a string using:
char debugStringBuffer[30];
void updateDebugString()
{
  static int count = 0;
  count++;
  snprintf(debugStringBuffer, sizeof(debugStringBuffer), "tick: %d", count);
  Application::getDebugPrinter()->setString(debugStringBuffer);
  Application::invalidateDebugRegion();
}
Note
DebugPrinter Classes
The DebugPrinter instance must be compatible to the LCD class used. This table lists the DebugPrinter class names:
| LCD class | DebugPrinter class |
|---|---|
| LCD1bpp | LCD1DebugPrinter |
| LCD2bpp | LCD2DebugPrinter |
| LCD4bpp | LCD4DebugPrinter |
| LCD8bpp_ARGB2222 | LCD8ARGB2222DebugPrinter |
| LCD8bpp_ABGR2222 | LCD8ABGR2222DebugPrinter |
| LCD8bpp_RGBA2222 | LCD8RGBA2222DebugPrinter |
| LCD8bpp_BGRA2222 | LCD8BGRA2222DebugPrinter |
| LCD16bpp | LCD16DebugPrinter |
| LCD16bppSerialFlash | LCD16DebugPrinter |
| LCD24bpp | LCD24DebugPrinter |
| LCD32bpp | LCD32DebugPrinter |
Use the DebugPrinter class that matches the LCD class you are using.