Performance
In this section we will discuss performance aspects of an embedded graphical user interface.
A high performance is here defined as getting a high frame rate while still obtaining the desired graphical effects and animations.
Let's recall from the previous section how the frame rate of the user interface is affected by the main loop. Assume again that there is a parallel RGB display attached to the LTDC and two framebuffers. The basic situation is illustrated below:
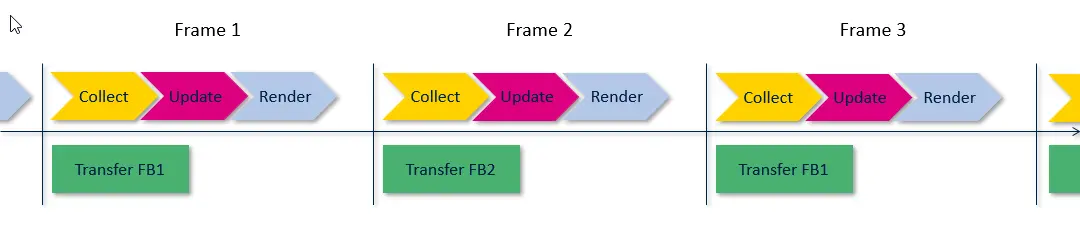
Double framebuffers
As the display is assumed refreshed 60 times each second there is approximately 16 ms between each refresh. The calculation is this: 1 s / 60 = 0.01667 s = 16.67 ms.
TouchGFX starts drawing frame 1 into framebuffer 2 at the time where the transfer of framebuffer 1 has started. If the rendering of frame 1 is finished before the next transfer starts we can transfer framebuffer 2. If not finished within 16.67 ms framebuffer 1 is transferred again and the display will appear unchanged:
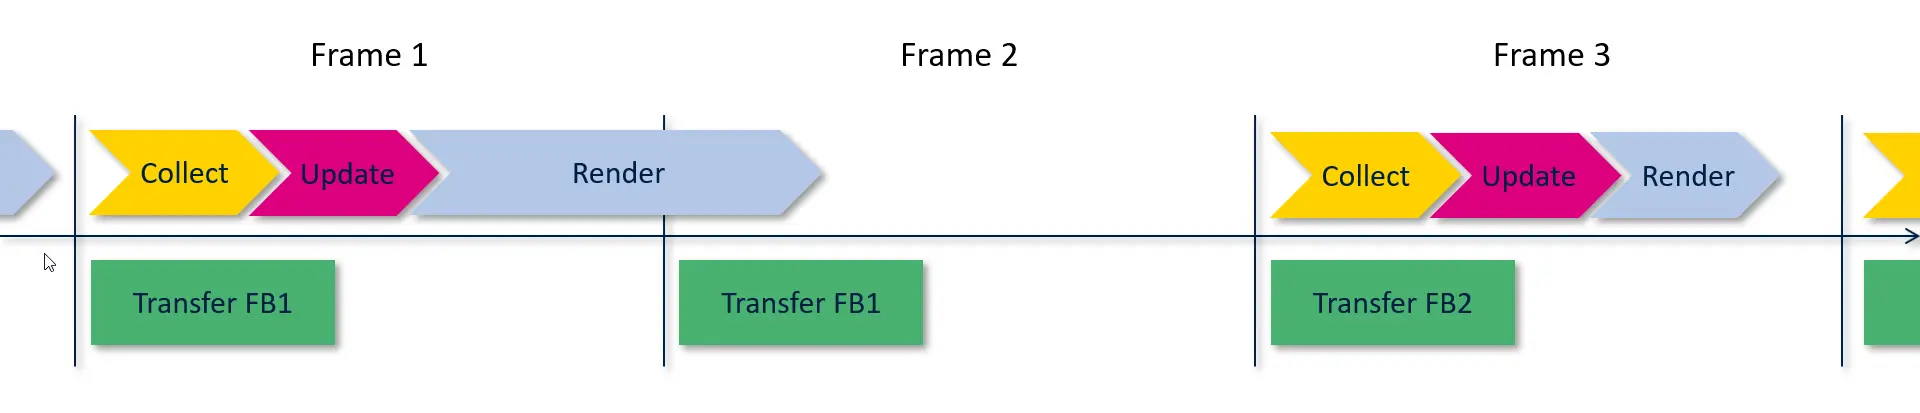
Main loop time above 16.67 ms
This situation is denoted a lost frame.
The time for the collect and update phases are typically minuscule, e.g. less than 1 ms, and therefore more or less neglectable when considering the overall time taken of the main loop. Therefore, in the following and in general, when considering render time, this includes the collect and update phases.
If the rendering time in many frames exceeds the 16.67 ms time limit the frame rate on the display will be 30 frames per second (fps).
If the rendering generally is shorter than 16.67 ms, but in some frames longer than 16.67 ms, the frame rate may be close to 60 fps in average, but the animation may not appear fluent to the user. Depending on the application it can look like some steps in the animation are fast and some are slow. This is not desireable.
The rendering time can also be even longer. If it is just above 33 ms, the framerate will drop to 20 fps as we only have a new frame ready on every third transfer.
| FPS | Max rendering time |
|---|---|
| 60 | 16.67 ms |
| 30 | 33.34 ms |
| 20 | 50.00 ms |
| 15 | 66.67 ms |
The table shows the maximum rendering time (including the collect and update phases) that is available for a given framerate.
To achieve a good performance of a user interface it can be very beneficial to check and monitor the frame rate regularly. Two approaches can be used:
- Measure the rendering time
- Count the lost frames
Measuring the Rendering Time
The first approach of measuring the rendering time gives the most detailed information. The idea is basically to measure the time from the frame transfer to the end of the rendering phase. The graphics engine calls a function on the GPIO class when the collect phase starts and makes another call when the rendering phase ends. The application defines these function and can hook into them to perform measurements.
The measurements can be done in two ways:
- Use external timing device like an oscilloscope:
To measure using an oscilloscope, the application should implement
the
set(GPIO_ID)andclear(GPIO_ID)methods from theGPIOinterface. The oscilloscope can then measure the rendering time as the time elapsed while the output is high. - Use an internal timer: Another approach is to use an internal timer, like the sysTick timer. When the GPIO::set(RENDER_TIME) is called the application can save the value of the timer in a variable. When the clear call is made the application can read the timer again and subtract the previous value to get the render time. The speed of the timer will define the resolution of the measurement. The application must somehow make the render time visible. One way is to save the value in a global variable and maybe show the value on the screen in a TextArea. The value can also be checked with a debugger.
Counting the Lost Frames
The graphics engine counts the number of transfers that has occurred during the last collect-update-rendering phase. The application can easily check this value to see if a frame was lost and the frame rate therefore lowered.
The count is available in the HAL class:
void handleTickEvent() {
  tickCounter += 1;
  if (HAL::getInstance()->getLCDRefreshCount() > 1) {
    //Alert programmer somehow
    ...
  }
}
Compensating for Lost Frames
When frames are lost and the framerate of one of our animations therefore lowered we can compensate to a certain degree. We can either:
- wait it out - let the animation go on, resulting in a longer animation duration, and possibly unsmooth animation.
- skip some frames - make sure that the overall animation does not take longer time than intended by skipping frames.
TouchGFX can be instructed to automaticallly skip some frames, when frames are lost. This can be accomplished by ticking animations more than once per actual frame. This can help in making animations more fluent when the render time is uneven.
HAL.hpp
void setFrameRateCompensation(bool enabled)
What Affects the Rendering Time?
A number of different things affect the rendering time: The size of the updated parts, the use of layering, the complexity of the widgets, and the available hardware support for the rendering.
How Much of the Screen Is Updated?
The rendering time is generally proportional to the number of pixels that must be updated. So if an animation takes too long time to render, a possible fix is to reduce the area of the animation. For example, if you have a rotating image and the performance is not good enough, the performance can be improved by reducing the size of the image.

Reducing image size reduces the rendering time
Remember that the graphics engine redraws the areas that the application invalidated. This means that it is important to only invalidate the areas that actually requires a refresh.
The larger the invalidated areas, the longer the render time.
The Number of Layers in the Graphics
In a typical application the graphics will consist of different elements that are stacked upon each other. If one of the elements is updated all the elements must typically be redrawn.
A typical example of this is a background image, a frame, and some text:

Layering graphical elements
This user interface is created by putting a TextArea widget on top of an Image widget showing a transparent frame. Both on top of the background Image:
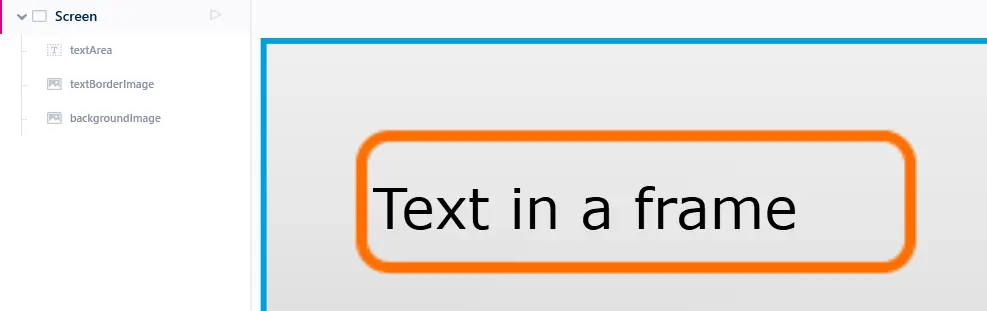
Layering graphical elements in TouchGFX Designer
This solution is used very often in application. It is a very easy solution with a high flexibility, as it is, for example, possible to change the frame at runtime or move the frame and the text on the background.
The problem regarding rendering time is that if the text is updated at runtime and needs to be redrawn, the graphics engine also needs to redraw the background and the frame; and then the new text. This increases the time to render the text considerably.
The more layers in an invalidated area, the longer the render time.
The Complexity of Rendering the Pixels
Not all pixels are equally difficult to render to the framebuffer. In all types of rendering the graphical engine must write the resulting pixel to the framebuffer. But the cost of calculating the pixel to write differs.
The fixed color, e.g. used in the Box Widget, has the lowest cost, as the calculation of a pixel is done once and reused for all the pixels. This means that we can get a very high performance by using a lot of Boxes. This is not recommended as the user interface will not be of high quality.
An image has the next lowest cost of pixel calculation since the pixels are stored in a ready to use format in the bitmaps. Calculating the pixel to write to the framebuffer is a matter of loading the color value from the correct place in the bitmap.
Text bears a cost comparable to images as the individual letters are actually represented as small images. In practice the cost is higher as the high number of small images gives rise to a considerable "start-stop" cost. For example the calculation of the position of the individual letters. In order for text to look as nice as possible, it is represented as small images with transparency, see the notes on transparency below.
Rotated or scaled images are more expensive. The task is again to load the pixel value from the bitmap, but this time it is a more time consuming calculation because the graphics engine has to incorporate the scaling and rotation.
Geometric elements like a circle are even more expensive. This time we cannot load the pixel color from a bitmap, but we have to calculate both the shape of the circle and the color of individual pixels in the circle.
Transparency adds to the cost of drawing an element. An element is transparent if some of the pixels are not solid. This increases the cost of drawing as the graphical engine first has to draw the element behind the transparent element (as we saw in the "text in a frame" section). Secondly the graphical engine then has to combine the background pixel with the pixel of the transparent element and write the result to the framebuffer. This calculation takes considerably more time than just writing the calculated pixel.
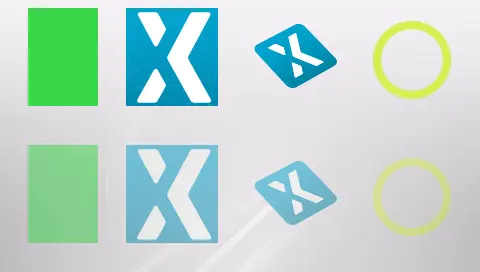
Box, Image, rotated Image, and circle. Solid elements in the first row. Transparent elements below.
Transparency always gives you an extra layer. But putting solid pixels on top of other solid pixels does not always increase the number of layers. The graphical engine tries to not draw pixels that are covered by other solid pixels, as this would be a waste of precious time.
The more expensive elements in the invalidated area, the longer the render time.
Remember that is only the elements that are part of the invalidated area, that adds to the rendering time. Elements outside of the invalidated areas do not impact the rendering time.
Read more about ui components and performance here.
Hardware Support for Rendering
Some STM32 microcontrollers contain a graphical accelerator called Chrom-ART (or DMA2D). This accelerator can reduce the rendering time. As the accelerator runs in parallel with the microcontroller core, the microcontroller is free to run other tasks while the accelerator renders graphics.
Chrom-ART is mainly useful for images and text. It is automatically used by the graphics engine when available.
When Should You Consider Rendering Time
Rendering time is not equally important all the time. You should pay attention to the rendering time when a slow frame rate is visible to the user. This is typically the case when you have an animation running on part of the screen (like a rotating icon) or when you move or slide something across the screen. If the update frequency is low it will appear step-wise instead of fluent to the user. If this is the case you should check the rendering time.
On the other hand, if you replace the whole screen with a new screen, it is normally not visible to the user if the frame rate dropped significantly during the change. This is because the user cannot see when the rendering started, but only when it finished.
These two rules mean that for animated elements (e.g. moving) you should use few layers and refrain from using complex elements and many layers. For other parts of the screen, this could be unproblematic.
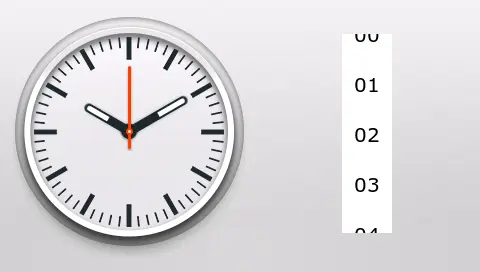
Analog clock and a scroll list
In this example we have an analog clock on the left. The three clock hands are rendered by rotating small elongated images. This is normally fine as the hands do not move all the time. But if we wanted to move the clock around on the screen, they would be redrawn in every frame and that could be problematic, as drawing rotated images is typically time consuming.
On the right we have a scroll list. The user can move this list of numbers up and down, so we need a high framerate for the user interface to appear responsive. Therefore it is important that we consider the rendering time of the elements in the scroll list or reduce the size of the scroll list.
Optimize Performance by Invalidating Content
Normally the entire widget is invalidated, but the graphics engine has the ability to only invalidate the content of a widget, instead of the entire widget. By reducing the area to invalidate, the render time will often be noticeably shorter. The improvement in render time depends on:
- The size of the area covered by the widget content relative to the size of the entire widget.
- The background widget(s) partly or fully covered by the widget.
The following figures illustrates the concept of invalidating content, by
using the TextArea widget as example. Figure 1 shows the entire
area of the widget. Figure 2 shows the invalidated area when using
TextArea::invalidate(). Figure 3 shows the invalidated area when using
TextArea::invalidateContent().
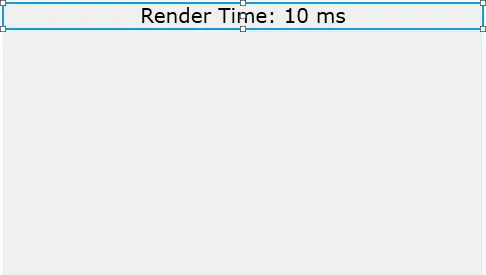
Figure 1. TextArea spanning across the entire screen width
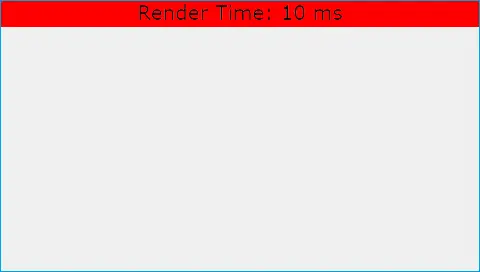
Figure 2. Invalidated area (red) when using TextArea::invalidate()
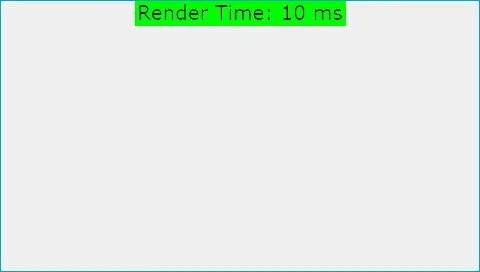
Figure 3. Invalidated area (green) when using TextArea::invalidateContent()
Example using TextArea::invalidateContent()
In cases where the widget is overlapping other widgets, these other widgets
will need to be redrawn when the entire TextArea is invalidated using
TextArea::invalidate(). By using TextArea::invalidateContent() instead,
we minimize the risk of unnecessary invalidating and redrawing widgets.
This is especially true for expensive widgets, e.g. Circle, Gauge, etc.
The figure below illustrates how we avoid invalidating a background widget
(Image - ST logo) using TextArea::invalidateContent(). The background
widget would have been invalidated and redrawn if we used TextArea::invalidate().
Example using TextArea::invalidateContent()
Tips To Get Good Performance
We end this section with a summary of the tips to obtain a good performance:
- Do not redraw unchanged things Make sure that you do not accidentally invalidate unnecessary parts of the display. This reduces the performance without any benefit.
- Find balance between quality and speed Reducing the complexity of the elements can improve the performance. A good balance between this and the performance is often the key.
- Utilize hardware capabilities The capability of a microcontroller with hardware acceleration (Chrom-ART) is often higher than a microcontroller without. Consider using a microcontroller with Chrom-ART.
- Replace calculated graphics with images The calculated circle is slower than an image of a circle. In general images can replace many static elements.
- Adjust display refresh rate As we discussed in the beginning of this section is the refresh rate a hard limit for the rendering time. If the rendering time exceeds the refresh rate, the frame rate drops. If your rendering time is just a little above the refresh rate, it may be possible to lower the refresh rate of the display to e.g. 55 Hz (corresponding to 18.2 ms), and keep the high frame rate.
Graphics Accelerators
A common way to achieve high performance is to use an STM32 MCU with a graphics accelerator. The STM32 MCU family uses two graphics accelerators: DMA2D and GPU2D. The DMA2D IP is also called ChromART. The GPU2D IP is also called NeoChrom.
The DMA2D accelerator is capable of copying and blending images between the image storage and the frame buffer. The GPU2D can do the same, but is also capable of texture mapping and vector graphics.
DMA2D comes in 3 versions. DMA2D version 1 is available in many STM32 MCUs. The version 2 included in the STM32H7 family is capable of converting YCbCr data to RGB. This improves the JPEG decoding performance. DMA2D version 3 supports more image formats and down-scaling.
Compared to the DMA2D graphics accelerator NeoChrom is capable of accelerating more graphical operations and has a richer feature set:
| Graphic feature | DMA2D | DMA2D v3 | GPU2D |
|---|---|---|---|
| Supported formats (with TouchGFX) | ARGB8888, RGB888, RGB565, A8, A4, L8-888, L8-8888 | ARGB8888, RGB888, RGB565, A8, A4, A2, A1, L8-565, L8-888, L8-8888 | ARGB8888, RGB888, RGB565, A8, A4, A2, A1 |
| Command list based | No | Yes | Yes |
| Drawing | Rectangles | Rectangles | Rectangles, Pixels, Line, Triangle, Quadrilaterals with multi-sample anti-aliasing (MSAA) |
| Blitting | Copy, alpha blending, pixel format conversion | Copy, alpha blending, pixel format conversion | Copy, alpha blending, pixel format conversion, color keying |
| Scaling | No | Yes (nearest neighbor) | Yes |
| Texture Mapping | No | No | Yes |
| Vector Graphics | No | No | No* |
* Vector Graphics are partially hardware-accelerated with NeoChrom when using TouchGFX. Full hardware acceleration for Vector Graphics is available with NeoChromVG.
With these capabilities available many TouchGFX Widgets are accelerated:
| Widget | DMA2D | DMA2D v3 | GPU2D |
|---|---|---|---|
| Box, BoxWithBorder | Yes | Yes | Yes |
| Image, AnimatedImage, TiledImage, SnapshotWidget | Yes | Yes | Yes |
| Button, ButtonWithIcon, ButtonWithLabel, ToggleButton | Yes | Yes | Yes |
| RadioButton, RepeatButton | Yes | Yes | Yes |
| PixelDataWidget | Yes | Yes | Yes |
| TextArea, TextAreaWithWildcard, Keyboard | Partly | Yes | Yes |
| ScalableImage | No | Partly | Yes |
| TextureMapper, AnimatedTextureMapper | No | No | Yes |
| Circle, Line, Graph, Gauge | No* | No* | No* |
| SVG | No* | No* | No** |
* The drawing/blending of pixels to the framebuffer is done by DMA2D, but the shape calculations are done in software.
** Hardware accelerated SVG drawing is available with NeoChromVG.
The operations that are not hardware accelerated are software rendered (implying a higher CPU-load, and lower performance). As the table above shows, NeoChrom can accelerate widgets like ScalableImage and TextureMapper. This means that we can use those widgets to a greater extent while keeping a high performance.
Read more about TouchGFX with NeoChrom here.